MRI and Automated Surface Mesh Modeling Analysis Reveal Changes in Brain Anatomy in Women with Multiple Sclerosis and Depression
|
By MedImaging International staff writers Posted on 13 Feb 2014 |
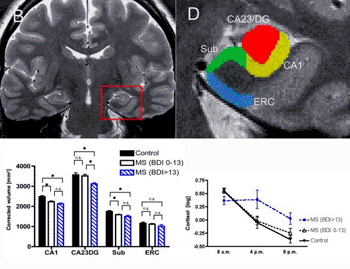
Image: MS Atrophy. Brain images showing location of hippocampus and its sub-regions in the brain. Bar graph shows atrophy within these specific hippocampal subregions. Black bars represent the control group; white bars represent people with MS who are not depressed; striped bars represent people with MS and depression (Photo courtesy of University of California - Los Angeles).
A multicenter team of US investigators are using a new, automated technique to identify shrinkage of a mood-regulating brain structure in a large study sample of women with multiple sclerosis (MS), who also have a specific type of depression.
Women with MS, in the study, and symptoms of “depressive affect,” such as depressed mood and loss of interest, were found to have reduced size of the right hippocampus. The left hippocampus remained unchanged and other types of depression, such as vegetative depression, which can bring about extreme fatigue, did not correlate with hippocampal size reduction, according to an article published in the January 2014 issue of the journal Human Brain Mapping.
This new study, led by Cedars-Sinai Medical Center (Los Angeles, CA, USA) neurologist Nancy Sicotte, MD, an expert in multiple sclerosis (MS) and cutting-edge imaging techniques, confirms earlier research suggesting that the hippocampus may be a contributor to the high frequency of depression in MS. Furthermore, it also revealed that a computer imaging technique called automated surface mesh modeling can promptly identify thickness alterations in subregions of the hippocampus. Before this, the process required a labor-intensive manual analysis of magnetic resonance imaging (MRI) images.
Dr. Sicotte, the article’s senior author, and others have earlier found evidence of tissue loss in the hippocampus, however, the changes could only be validated in manual tracings of a set of special high-resolution MRI images. The new application can use more easily obtainable MRI scans and it automates the brain mapping process. “Patients with medical disorder and in particular, those with inflammatory diseases such as MS, often suffer from depression, which can cause fatigue. But not all fatigue is caused by depression. We believe that while fatigue and depression often co-occur in patients with MS, they may be brought about by different biological mechanisms. Our studies are designed to help us better understand how MS-related depression differs from other types, improve diagnostic imaging systems to make them more widely available and efficient, and create better, more individualized treatments for our patients,” said Dr. Sicotte, director of Cedars-Sinai’s Multiple Sclerosis Program and the Neurology Residency Program.
Related Links:
Cedars-Sinai Medical Center
Latest MRI News
- Low-Cost Whole-Body MRI Device Combined with AI Generates High-Quality Results
- World's First Whole-Body Ultra-High Field MRI Officially Comes To Market
- World's First Sensor Detects Errors in MRI Scans Using Laser Light and Gas
- Diamond Dust Could Offer New Contrast Agent Option for Future MRI Scans
- Combining MRI with PSA Testing Improves Clinical Outcomes for Prostate Cancer Patients
- PET/MRI Improves Diagnostic Accuracy for Prostate Cancer Patients
- Next Generation MR-Guided Focused Ultrasound Ushers In Future of Incisionless Neurosurgery
- Two-Part MRI Scan Detects Prostate Cancer More Quickly without Compromising Diagnostic Quality
- World’s Most Powerful MRI Machine Images Living Brain with Unrivaled Clarity
- New Whole-Body Imaging Technology Makes It Possible to View Inflammation on MRI Scan
- Combining Prostate MRI with Blood Test Can Avoid Unnecessary Prostate Biopsies
- New Treatment Combines MRI and Ultrasound to Control Prostate Cancer without Serious Side Effects
- MRI Improves Diagnosis and Treatment of Prostate Cancer
- Combined PET-MRI Scan Improves Treatment for Early Breast Cancer Patients
- 4D MRI Could Improve Clinical Assessment of Heart Blood Flow Abnormalities
- MRI-Guided Focused Ultrasound Therapy Shows Promise in Treating Prostate Cancer
Channels
Radiography
view channel
Novel Breast Imaging System Proves As Effective As Mammography
Breast cancer remains the most frequently diagnosed cancer among women. It is projected that one in eight women will be diagnosed with breast cancer during her lifetime, and one in 42 women who turn 50... Read more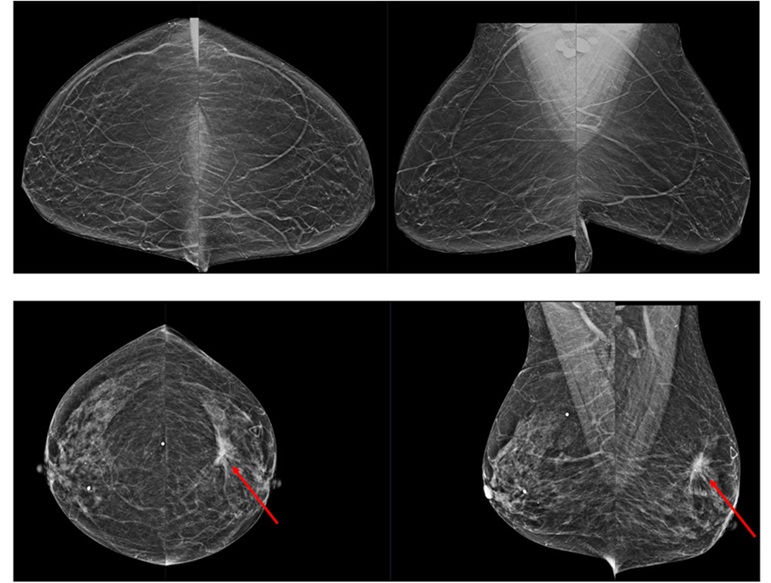
AI Assistance Improves Breast-Cancer Screening by Reducing False Positives
Radiologists typically detect one case of cancer for every 200 mammograms reviewed. However, these evaluations often result in false positives, leading to unnecessary patient recalls for additional testing,... Read moreUltrasound
view channel.jpg)
Diagnostic System Automatically Analyzes TTE Images to Identify Congenital Heart Disease
Congenital heart disease (CHD) is one of the most prevalent congenital anomalies worldwide, presenting substantial health and financial challenges for affected patients. Early detection and treatment of... Read more
Super-Resolution Imaging Technique Could Improve Evaluation of Cardiac Conditions
The heart depends on efficient blood circulation to pump blood throughout the body, delivering oxygen to tissues and removing carbon dioxide and waste. Yet, when heart vessels are damaged, it can disrupt... Read more
First AI-Powered POC Ultrasound Diagnostic Solution Helps Prioritize Cases Based On Severity
Ultrasound scans are essential for identifying and diagnosing various medical conditions, but often, patients must wait weeks or months for results due to a shortage of qualified medical professionals... Read moreNuclear Medicine
view channelNew PET Agent Rapidly and Accurately Visualizes Lesions in Clear Cell Renal Cell Carcinoma Patients
Clear cell renal cell cancer (ccRCC) represents 70-80% of renal cell carcinoma cases. While localized disease can be effectively treated with surgery and ablative therapies, one-third of patients either... Read more
New Imaging Technique Monitors Inflammation Disorders without Radiation Exposure
Imaging inflammation using traditional radiological techniques presents significant challenges, including radiation exposure, poor image quality, high costs, and invasive procedures. Now, new contrast... Read more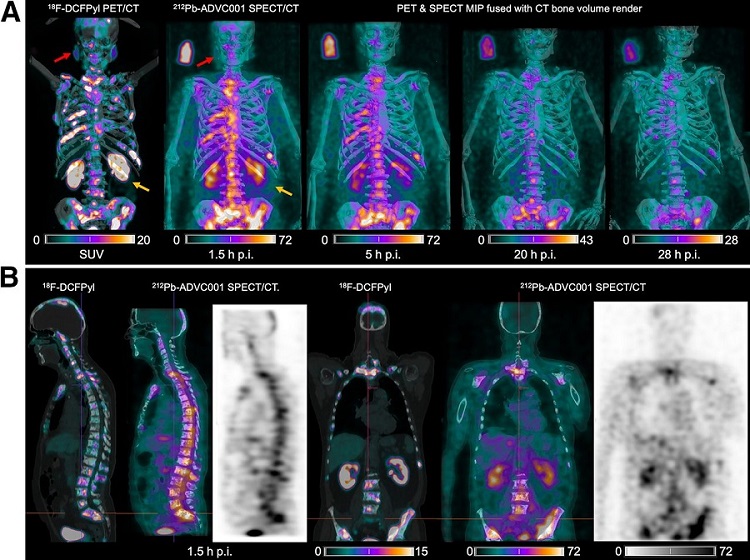
New SPECT/CT Technique Could Change Imaging Practices and Increase Patient Access
The development of lead-212 (212Pb)-PSMA–based targeted alpha therapy (TAT) is garnering significant interest in treating patients with metastatic castration-resistant prostate cancer. The imaging of 212Pb,... Read moreGeneral/Advanced Imaging
view channel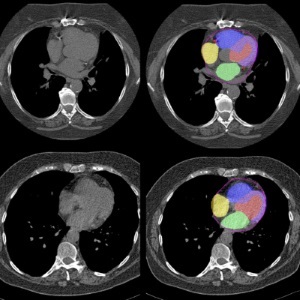
AI Predicts Cardiac Risk and Mortality from Routine Chest CT Scans
Heart disease remains the leading cause of death and is largely preventable, yet many individuals are unaware of their risk until it becomes severe. Early detection through screening can reveal heart issues,... Read more
Radiation Therapy Computed Tomography Solution Boosts Imaging Accuracy
One of the most significant challenges in oncology care is disease complexity in terms of the variety of cancer types and the individualized presentation of each patient. This complexity necessitates a... Read moreImaging IT
view channel
New Google Cloud Medical Imaging Suite Makes Imaging Healthcare Data More Accessible
Medical imaging is a critical tool used to diagnose patients, and there are billions of medical images scanned globally each year. Imaging data accounts for about 90% of all healthcare data1 and, until... Read more
Global AI in Medical Diagnostics Market to Be Driven by Demand for Image Recognition in Radiology
The global artificial intelligence (AI) in medical diagnostics market is expanding with early disease detection being one of its key applications and image recognition becoming a compelling consumer proposition... Read moreIndustry News
view channel
Hologic Acquires UK-Based Breast Surgical Guidance Company Endomagnetics Ltd.
Hologic, Inc. (Marlborough, MA, USA) has entered into a definitive agreement to acquire Endomagnetics Ltd. (Cambridge, UK), a privately held developer of breast cancer surgery technologies, for approximately... Read more
Bayer and Google Partner on New AI Product for Radiologists
Medical imaging data comprises around 90% of all healthcare data, and it is a highly complex and rich clinical data modality and serves as a vital tool for diagnosing patients. Each year, billions of medical... Read more


