


MRI and Automated Surface Mesh Modeling Analysis Reveal Changes in Brain Anatomy in Women with Multiple Sclerosis and Depression
|
By MedImaging International staff writers Posted on 13 Feb 2014 |
|
.")
Image: MS Atrophy. Brain images showing location of hippocampus and its sub-regions in the brain. Bar graph shows atrophy within these specific hippocampal subregions. Black bars represent the control group; white bars represent people with MS who are not depressed; striped bars represent people with MS and depression (Photo courtesy of University of California - Los Angeles).
A multicenter team of US investigators are using a new, automated technique to identify shrinkage of a mood-regulating brain structure in a large study sample of women with multiple sclerosis (MS), who also have a specific type of depression.
Women with MS, in the study, and symptoms of “depressive affect,” such as depressed mood and loss of interest, were found to have reduced size of the right hippocampus. The left hippocampus remained unchanged and other types of depression, such as vegetative depression, which can bring about extreme fatigue, did not correlate with hippocampal size reduction, according to an article published in the January 2014 issue of the journal Human Brain Mapping.
This new study, led by Cedars-Sinai Medical Center (Los Angeles, CA, USA) neurologist Nancy Sicotte, MD, an expert in multiple sclerosis (MS) and cutting-edge imaging techniques, confirms earlier research suggesting that the hippocampus may be a contributor to the high frequency of depression in MS. Furthermore, it also revealed that a computer imaging technique called automated surface mesh modeling can promptly identify thickness alterations in subregions of the hippocampus. Before this, the process required a labor-intensive manual analysis of magnetic resonance imaging (MRI) images.
Dr. Sicotte, the article’s senior author, and others have earlier found evidence of tissue loss in the hippocampus, however, the changes could only be validated in manual tracings of a set of special high-resolution MRI images. The new application can use more easily obtainable MRI scans and it automates the brain mapping process. “Patients with medical disorder and in particular, those with inflammatory diseases such as MS, often suffer from depression, which can cause fatigue. But not all fatigue is caused by depression. We believe that while fatigue and depression often co-occur in patients with MS, they may be brought about by different biological mechanisms. Our studies are designed to help us better understand how MS-related depression differs from other types, improve diagnostic imaging systems to make them more widely available and efficient, and create better, more individualized treatments for our patients,” said Dr. Sicotte, director of Cedars-Sinai’s Multiple Sclerosis Program and the Neurology Residency Program.
Related Links:
Cedars-Sinai Medical Center
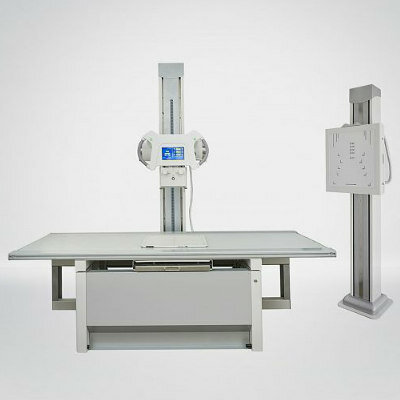
X-ray Diagnostic System
FDX Visionary-A
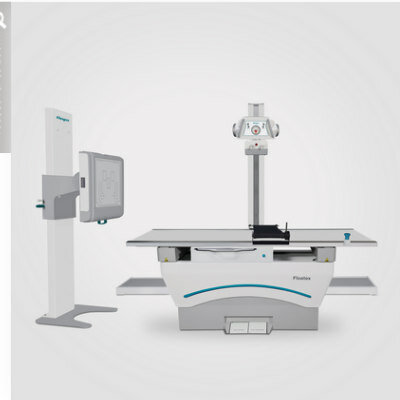
Medical Radiographic X-Ray Machine
TR30N HF
Pocket Fetal Doppler
CONTEC10C/CL
Digital Radiography System (Ceiling Free)
Digix CF Series
Latest MRI News
- Advanced MRI Reveals Structural Brain Changes Linked to Better Cognitive Health
- Cardiac MRI Detects Hidden Heart Dysfunction After Heart Attack
- AI Tool Reveals Cortical Lesions on Standard MRI in Multiple Sclerosis
- AI Reconstruction Tool Speeds Dynamic Breast MRI and Improves Cancer Detection
- International Study Assesses AI for Prostate Cancer MRI Interpretation
- AI Approach Could Shorten Advanced Brain MRI Scans by Up to 90%
- Cardiac MRI Measure Improves Risk Prediction in Tricuspid Regurgitation
- AI System Improves Accuracy of Cardiac MRI Interpretation
- Deep Learning Model Predicts Alzheimer’s Disease Outcomes from Baseline MRI
- Blood-Brain Barrier Imaging Adds Risk Insight to Standard Stroke MRI
- AI Body Composition MRI Analysis Predicts Cardiometabolic Disease Risk
- AI MRI Tool Quantifies Muscle Fat to Assess Cardiometabolic Risk
- Advanced MRI Visualizes CSF Motion Changes After Mild Traumatic Brain Injury
- MRI Tool Enables Long-Term Tracking of Transplanted Cardiac Cells
- MRI-Based AI Tool Supports Differentiation of Parkinsonian Syndromes
- MRI-Derived Biomarker Improves Risk Stratification in Glioblastoma
Channels
Radiography
view channel is compared with conventional radiology (b) under identical photon counts. (Photo courtesy of Tiqiao Xiao, Shanghai Advanced Research Institute, Chinese Academy of Sciences)")
Computational X-Ray Technique Enables High-Resolution, Low-Dose Radiography
Reducing radiation in medical X-ray imaging remains a persistent challenge because dose reductions often degrade spatial resolution and diagnostic confidence. This is especially critical in pediatrics,... Read more 2015, (B) 2018, (C) 2019, and (D) 2021. In (E) 2022, a new mass developed in the left breast at the 6-o’clock position (arrow), with a (F) corresponding irregular mass at US (arrow). Subsequent US-guided core needle biopsy yielded invasive ductal carcinoma, grade 2. The deep learning 5-year risk scores gradually increased from 2.0 (2015) to 2.1 (2018), 3.4 (2019), 3.6 (2021), and 15.3 (2022). CMFN = centimeters from nipple, LT = left, TRANS = transverse (Photo courtesy of Radiological Society of North America)")
AI Tool Predicts Five-Year Breast Cancer Risk from Mammograms
Breast cancer risk assessment during routine screening is difficult because many women who develop the disease have no known genetic mutations or family history. Static risk tools provide limited discrimination... Read more score changes over time in two individuals with screen-detected cancer. Full-field digital mammograms show craniocaudal (top) and mediolateral (bottom) views of the left and right breast (Photo courtesy of Radiological Society of North America)")
 to evaluate the severity of Pulmonary Regurgitation (PR), a common complication after treatment of the congenital heart disease Tetralogy of Fallot. The analysis only requires the patient to hold their breath for seven seconds for a sequence of images of their heart to be taken. The images are then analyzed and extracted into a waveform that can show the severity of PR. The new technique\\\'s detection accuracy of severe PR is 93%, with a sensitivity of 93% and a specificity of 94%. (Photo courtesty of Kyushu University/Yuzo Yamasaki)")
Ultrasound
view channel
Simple 2D Ultrasound Tool Accurately Estimates Placental Volume
Stillbirth remains a major cause of perinatal loss, with about 21,000 cases annually in the United States. Although placental abnormalities are linked to adverse pregnancy outcomes, routine monitoring... Read more for portable and operator-independent monitoring (Nayeem, M.O.G., Viswanath, S., Yoon, H. et al. Nature Communications (2026. https://doi.org/10.1038/s41467-026-74708-3)")
Portable 3D Ultrasound System Enables Reproducible Breast Cancer Monitoring
Breast cancer can develop between annual mammograms, and these interval cancers account for 20% to 30% of cases and tend to be more aggressive. The challenge is pronounced in people with dense breast tissue.... Read more")
 and the tracer highlighting the glymphatic system (red-yellow) along the brain’s surface and drainage routes—imaged through the intact skull with 3D-PAULM. (Photo courtesy of Duke University)")
Nuclear Medicine
view channel
Radiotherapy Professionals Embrace AI as a Clinical Support Tool
Radiotherapy planning requires precise identification of organs at risk near a tumor, but manual contouring is repetitive and time-consuming, often delaying plan completion and straining specialist capacity.... Read more
Second PSMA PET Identifies Disease in More Than Half of Negative Cases
Biochemical recurrence of prostate cancer after prostatectomy or radiation can be difficult to localize when imaging is negative. Uncertain disease sites may delay salvage therapy and expose patients to... Read more![Image: (A-C) Representative whole-body maximum-intensity projection images and regional fused PET/CT images from three histologically confirmed osteosarcoma patients who underwent paired [68Ga]Ga-B7-H3-BCH PET/CT and 18F-FDGE PET/CT within 7 days. (D) Multimodal imaging evaluation of patient 3, including X-ray, MRI (T2-weighted imaging, T2WI), CT, and B7-H3 PET/CT. (Photo courtesy of SNMMI)](https://globetechcdn.com/mobile_medicalimaging/images/stories/articles/article_images/2026-06-07/294811110_image_1.jpg "Image: (A-C) Representative whole-body maximum-intensity projection images and regional fused PET/CT images from three histologically confirmed osteosarcoma patients who underwent paired [68Ga]Ga-B7-H3-BCH PET/CT and 18F-FDGE PET/CT within 7 days. (D) Multimodal imaging evaluation of patient 3, including X-ray, MRI (T2-weighted imaging, T2WI), CT, and B7-H3 PET/CT. (Photo courtesy of SNMMI)")
General/Advanced Imaging
view channel Pulmonary embolism (PE) chest axial CT angiography image demonstrating acute pulmonary embolus (arrows). (B) PE chest axial CT angiography image demonstrating subacute pulmonary embolus (arrow). (C) PE chest axial CT angiography image demonstrating webs/scarring from prior pulmonary embolus (arrows) (Image Credit: Radiological Society of North America)")
New PE-RADS Framework Standardizes Pulmonary Embolism Imaging Reports
Pulmonary embolism is a sudden blockage of the lung’s blood vessels that reduces pulmonary blood flow, can strain the right hear,t and may be fatal if untreated. Patients often present with shortness of... Read more")
Virtual Staining Technique Creates Histology Images from CT Data
Pulmonary hypertension, a disorder marked by pathological remodeling of the pulmonary vessels, often requires detailed histologic assessment. Yet routine pathology remains anchored in labor‑intensive,... Read more")
CT-Derived Biomarker Predicts Outcomes in Gastric Cancer
Gastric cancer, also known as stomach cancer, is the fifth most common malignancy worldwide and often shows heterogeneous outcomes even within the same stage. Prognostic estimates typically rely on tumor-centric... Read more")
AI Tool Enhances Response Assessment and Survival Prediction in Pleural Mesothelioma
Pleural mesothelioma, a cancer that grows as a thin, irregular layer along the lung wall, is difficult to measure on imaging. Clinicians rely on diameter-based Response Evaluation Criteria in Solid Tumors... Read moreImaging IT
view channel")
Ambient AI Reporting Platform Streamlines Radiology Reporting
Radiology departments face growing imaging volumes and staffing shortages, creating reporting bottlenecks and pressure to maintain turnaround times. Conventional dictation tools document findings after... Read more")
Interactive AI Tool Supports Explainable Lung Nodule Assessment
Lung cancer is a leading cause of cancer mortality, and timely characterization of pulmonary nodules on chest computed tomography (CT) is essential for directing care. Interpreting nodule morphology demands... Read more")
Breast Imaging Software Enhances Visualization and Tissue Characterization in Challenging Cases
Breast imaging can be particularly challenging in cases involving small breasts or implants, where image reconstruction and tissue characterization may be limited. Clinicians also need reproducible analysis... Read more")
Industry News
view channel-pending software for dynamic PET imaging and kinetic modeling, enabling time-based radiotracer analysis for clinical and research decisions (Photo courtesy of GE Healthcare)")
GE HealthCare Showcases AI-Enabled Nuclear Medicine Portfolio at SNMMI 2026
Nuclear medicine is expanding rapidly as health systems adopt theranostics and broaden access to radiopharmaceuticals, increasing demand for scalable operations and consistent diagnostic confidence.... Read more")
GE HealthCare Highlights AI-Supported Radiation Therapy Tools at ESTRO 2026
At the European Society for Radiotherapy and Oncology (ESTRO) 2026 Congress in Stockholm, GE HealthCare is highlighting Intelligent Radiation Therapy (iRT), MIM Software innovations, and BK Medical surgical... Read more")
")