Computed Tomography (CT) Dose Can Be Decided by Size of Patient’s T-Shirt
|
By MedImaging International staff writers Posted on 07 Apr 2022 |

A study examining size-based reference doses for different types of CT examination has found that T-shirt size could provide a perception of dose differences in patients of different body-build.
The study by investigators at the Massachusetts General Hospital (Boston, MA, USA) aimed to examine the impact of patient size on dose indices and develop size-based reference levels (50th and 75th percentiles) for 20 body CT exams for routine and organ-specific clinical indications. Based on effective diameter estimated from adult body CT, each acquisition was classified into T-shirt size as XXS, XS, S, M, L, XL, and XXL. Radiation dose indices for each size and each exam type were correlated. The investigators analyzed about 0.93 million CT exams from 256 CT facilities in the US. Taking T-shirt size M as a reference, the CTDIvol for other sizes were: XXS (∼60%), XS (∼65%), S (∼75%), L (∼130%), XL (∼165%), XXL (∼210%), or grossly small patients received about 60% of the dose as compared to M sized patients and XXL required doubling the dose.
Taking ratio of the dose indices of the largest to smallest size, the results showed that SSDE variation was much less (about 50%) than that in CTDIvol, but there was still nearly 40 to 220% variation in SSDE across the range of T-shirt sizes. The 50th and 75th percentile values are presented for CTDIvol, SSDE and DLP for each of the 20 CT exams and for each of the seven T-shirt sizes. Based on the findings, the researchers concluded that the novel approach expressing body habitus in terms of T-shirt size was not only simple and intuitive, but also provides a tool to have a perception of differences in dose metrices among patients of different body build.
Related Links:
Massachusetts General Hospital
Latest General/Advanced Imaging News
- PET Scans Reveal Hidden Inflammation in Multiple Sclerosis Patients
- Artificial Intelligence Evaluates Cardiovascular Risk from CT Scans
- New AI Method Captures Uncertainty in Medical Images
- CT Coronary Angiography Reduces Need for Invasive Tests to Diagnose Coronary Artery Disease
- Novel Blood Test Could Reduce Need for PET Imaging of Patients with Alzheimer’s
- CT-Based Deep Learning Algorithm Accurately Differentiates Benign From Malignant Vertebral Fractures
- Minimally Invasive Procedure Could Help Patients Avoid Thyroid Surgery
- Self-Driving Mobile C-Arm Reduces Imaging Time during Surgery
- AR Application Turns Medical Scans Into Holograms for Assistance in Surgical Planning
- Imaging Technology Provides Ground-Breaking New Approach for Diagnosing and Treating Bowel Cancer
- CT Coronary Calcium Scoring Predicts Heart Attacks and Strokes
- AI Model Detects 90% of Lymphatic Cancer Cases from PET and CT Images
- Breakthrough Technology Revolutionizes Breast Imaging
- State-Of-The-Art System Enhances Accuracy of Image-Guided Diagnostic and Interventional Procedures
- Catheter-Based Device with New Cardiovascular Imaging Approach Offers Unprecedented View of Dangerous Plaques
- AI Model Draws Maps to Accurately Identify Tumors and Diseases in Medical Images
Channels
Radiography
view channel
Novel Breast Imaging System Proves As Effective As Mammography
Breast cancer remains the most frequently diagnosed cancer among women. It is projected that one in eight women will be diagnosed with breast cancer during her lifetime, and one in 42 women who turn 50... Read more
AI Assistance Improves Breast-Cancer Screening by Reducing False Positives
Radiologists typically detect one case of cancer for every 200 mammograms reviewed. However, these evaluations often result in false positives, leading to unnecessary patient recalls for additional testing,... Read moreMRI
view channel
World's First Sensor Detects Errors in MRI Scans Using Laser Light and Gas
MRI scanners are daily tools for doctors and healthcare professionals, providing unparalleled 3D imaging of the brain, vital organs, and soft tissues, far surpassing other imaging technologies in quality.... Read more
Diamond Dust Could Offer New Contrast Agent Option for Future MRI Scans
Gadolinium, a heavy metal used for over three decades as a contrast agent in medical imaging, enhances the clarity of MRI scans by highlighting affected areas. Despite its utility, gadolinium not only... Read more.jpg)
Combining MRI with PSA Testing Improves Clinical Outcomes for Prostate Cancer Patients
Prostate cancer is a leading health concern globally, consistently being one of the most common types of cancer among men and a major cause of cancer-related deaths. In the United States, it is the most... Read moreUltrasound
view channel
Largest Model Trained On Echocardiography Images Assesses Heart Structure and Function
Foundation models represent an exciting frontier in generative artificial intelligence (AI), yet many lack the specialized medical data needed to make them applicable in healthcare settings.... Read more.jpg)
Groundbreaking Technology Enables Precise, Automatic Measurement of Peripheral Blood Vessels
The current standard of care of using angiographic information is often inadequate for accurately assessing vessel size in the estimated 20 million people in the U.S. who suffer from peripheral vascular disease.... Read more
Deep Learning Advances Super-Resolution Ultrasound Imaging
Ultrasound localization microscopy (ULM) is an advanced imaging technique that offers high-resolution visualization of microvascular structures. It employs microbubbles, FDA-approved contrast agents, injected... Read more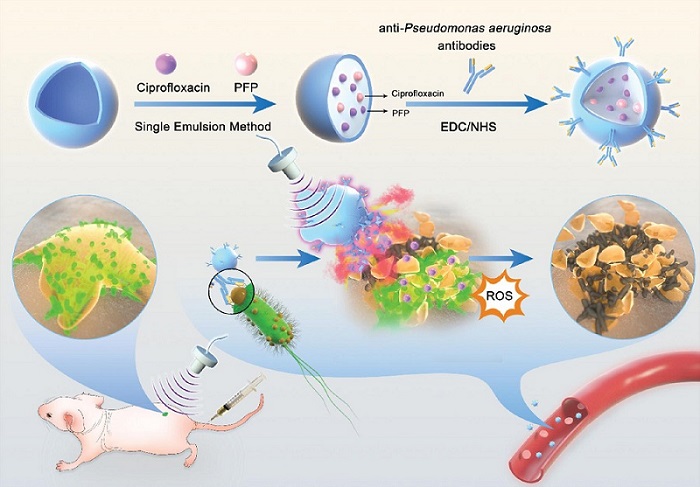
Novel Ultrasound-Launched Targeted Nanoparticle Eliminates Biofilm and Bacterial Infection
Biofilms, formed by bacteria aggregating into dense communities for protection against harsh environmental conditions, are a significant contributor to various infectious diseases. Biofilms frequently... Read moreNuclear Medicine
view channel
New Imaging Technique Monitors Inflammation Disorders without Radiation Exposure
Imaging inflammation using traditional radiological techniques presents significant challenges, including radiation exposure, poor image quality, high costs, and invasive procedures. Now, new contrast... Read more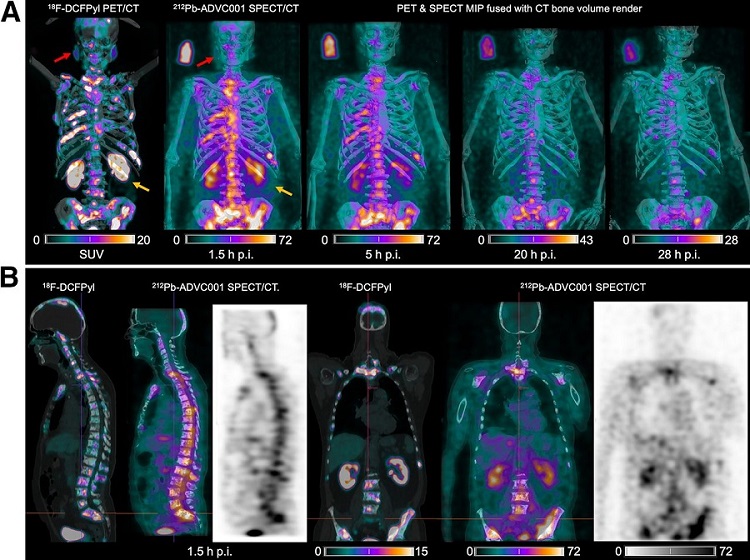
New SPECT/CT Technique Could Change Imaging Practices and Increase Patient Access
The development of lead-212 (212Pb)-PSMA–based targeted alpha therapy (TAT) is garnering significant interest in treating patients with metastatic castration-resistant prostate cancer. The imaging of 212Pb,... Read moreNew Radiotheranostic System Detects and Treats Ovarian Cancer Noninvasively
Ovarian cancer is the most lethal gynecological cancer, with less than a 30% five-year survival rate for those diagnosed in late stages. Despite surgery and platinum-based chemotherapy being the standard... Read more
AI System Automatically and Reliably Detects Cardiac Amyloidosis Using Scintigraphy Imaging
Cardiac amyloidosis, a condition characterized by the buildup of abnormal protein deposits (amyloids) in the heart muscle, severely affects heart function and can lead to heart failure or death without... Read moreImaging IT
view channel
New Google Cloud Medical Imaging Suite Makes Imaging Healthcare Data More Accessible
Medical imaging is a critical tool used to diagnose patients, and there are billions of medical images scanned globally each year. Imaging data accounts for about 90% of all healthcare data1 and, until... Read more
Global AI in Medical Diagnostics Market to Be Driven by Demand for Image Recognition in Radiology
The global artificial intelligence (AI) in medical diagnostics market is expanding with early disease detection being one of its key applications and image recognition becoming a compelling consumer proposition... Read moreIndustry News
view channel
Bayer and Google Partner on New AI Product for Radiologists
Medical imaging data comprises around 90% of all healthcare data, and it is a highly complex and rich clinical data modality and serves as a vital tool for diagnosing patients. Each year, billions of medical... Read more


